
Choosing when to visit Torrevieja depends on whether you want beaches, walks or a quiet stay: this guide explains the seasons and provides a monthly climate reference, without confusing it with the daily forecast.
The coastal scenery invites you to spend time outdoors, but a January break and an August holiday call for different plans and packing.
To compare months, we use AEMET’s climate normals for Alicante-Elche Aeropuerto, station 8019, for 1981–2010. Located in Elche at an altitude of 43 metres, this station provides a regional approximation, not measurements taken in Torrevieja.
Averages help you plan a trip in advance; deciding on an excursion, a swim or a drive requires the current forecast and weather warnings for Torrevieja.
Monthly table: a nearby reference, not local data
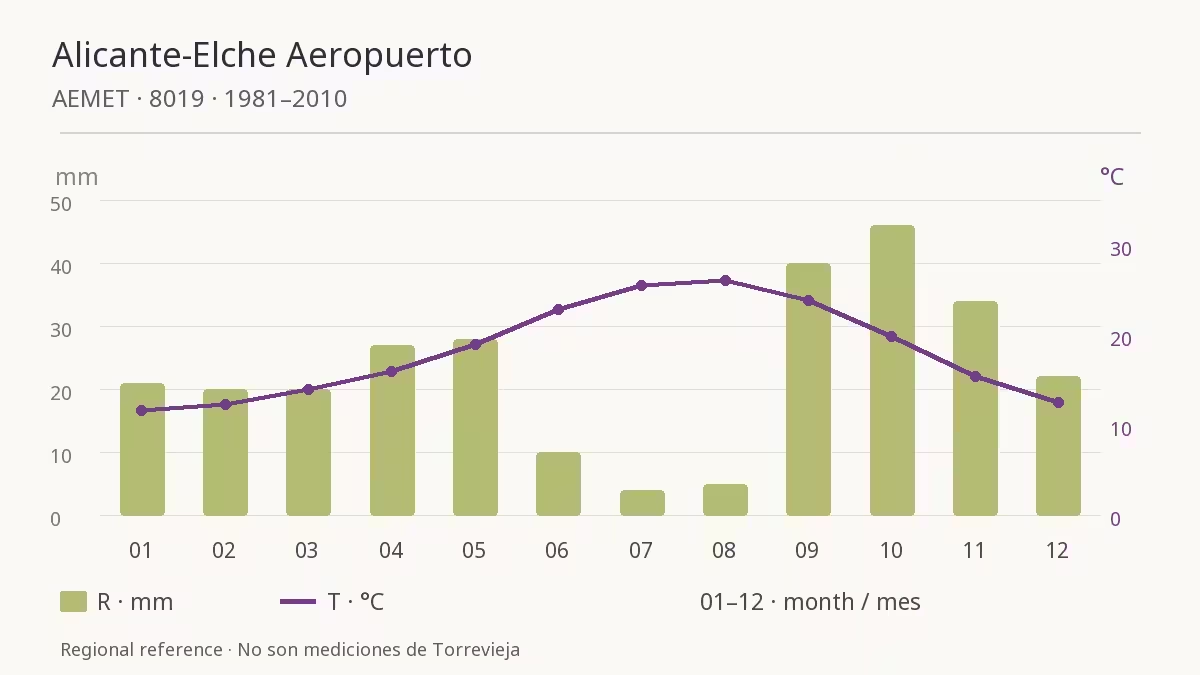
The table reproduces AEMET data for Alicante-Elche Aeropuerto for 1981–2010: monthly mean temperature, average daily maximum, average daily minimum and average monthly rainfall.
| Month | Mean °C | Average maximum °C | Average minimum °C | Average rainfall mm |
|---|---|---|---|---|
| January | 11.6 | 16.7 | 6.5 | 21 |
| February | 12.3 | 17.4 | 7.1 | 20 |
| March | 14.0 | 19.4 | 8.7 | 20 |
| April | 15.9 | 21.1 | 10.7 | 27 |
| May | 18.9 | 23.8 | 13.9 | 28 |
| June | 22.8 | 27.6 | 18.0 | 10 |
| July | 25.5 | 30.1 | 20.8 | 4 |
| August | 26.1 | 30.7 | 21.5 | 5 |
| September | 23.8 | 28.5 | 19.0 | 40 |
| October | 19.8 | 24.7 | 14.9 | 46 |
| November | 15.4 | 20.3 | 10.6 | 34 |
| December | 12.5 | 17.3 | 7.5 | 22 |
An average maximum of 30.7 °C is not an upper limit: there can be hotter days, just as an average minimum does not identify the coldest night.
Nor does 46 mm of rainfall in October mean that a little rain falls every day; a monthly average does not describe how rainfall is distributed or allow you to predict a particular storm.
The chosen historical period allows for consistent comparisons, but does not by itself describe the current climate or incorporate all the changes of recent decades.
January and February: walks with flexible plans
The first months of the year are an option for exploring the town centre and seafront without building your trip around swimming.
At the reference station, average minimum temperatures in January and February are below midday temperatures, so it is worth bringing layers and a windproof outer layer.
A coastal walk can be combined with a cultural visit when the weather worsens, provided you check the chosen venue’s opening hours beforehand.
If you book an apartment for several weeks, check its heating and which way it faces: a destination’s relatively mild winters do not guarantee comfort inside every property.
March, April and May: room to explore

Rising temperatures open up opportunities to alternate town walks, beach visits without necessarily swimming, and routes through natural areas where access is permitted.
March still has cool mornings and nights in AEMET’s reference data; temperatures rise gradually in April and May, without removing the possibility of rain.
For a first trip focused on exploring, these months allow you to arrange activities at different times of day and adapt each day to the forecast.
Pack comfortable footwear, sun protection and a light layer, rather than filling your suitcase with beachwear alone.
June, July and August: planning around the heat
At Alicante-Elche Aeropuerto, July and August have the highest mean temperatures in the table and particularly low average rainfall.
This pattern helps guide summer holiday plans, but does not guarantee continuously clear skies or rule out spells of intense heat.
Save long walks for the cooler parts of the day and leave the middle of the day for meals, rest or an activity suited to the actual conditions.
Carry water and sun protection even on a short walk; a breeze is no substitute for shade and is not a measure of radiation levels.
For comfortable nights, check your accommodation’s ventilation or air conditioning and the conditions for using it, especially if travelling with children or people sensitive to heat.
September and October: mild does not mean rain-free

September retains a mean temperature of 23.8 °C at the station used, falling to 19.8 °C in October: regional values that explain the appeal of these months for outdoor activities.
At the same time, average rainfall increases compared with summer: October has the highest average rainfall in this particular table.
That does not make every autumn rainy, but it is a reason to choose flexible bookings and have an alternative for bad-weather days.
When rain or storm warnings are in force, change your route and follow the authorities’ advice; a historical average never justifies entering a flooded area.
November and December: a different stay from summer
Reference temperatures fall and nights call for warmer clothing, although a daytime walk can be pleasant when the weather is favourable.
These are months for combining the town, the coast and cultural events, without taking summer services or water activities for granted.
At the lagoons, always respect the routes and restrictions within the protected area; the appeal of a photograph does not give you permission to leave the authorised access routes.
If you plan to work remotely or stay for several weeks, comfortable accommodation matters as much as the outdoor temperature: check the heating, internet connection and the property’s conditions.
Which season to choose for your trip
For a visit focused on walks and heritage, consider spring and autumn and keep one day’s plans interchangeable in case the forecast changes.
If your priority is a summer holiday, June to August fall within the warm part of the reference data, but swimming also depends on sea conditions and the instructions at the beach.
For a winter stay, think in terms of an everyday routine rather than repeating an August itinerary every day: layered clothing and comfortable accommodation are basic choices.
There is no perfect month for everyone: choosing between heat, cooler weather and flexibility is more useful than seeking a promise of permanent fine weather.
Before setting out: three useful checks
Consult AEMET’s municipal forecast for your chosen date, review weather warnings and check sea conditions if your plans include the beach.
Distinguish between air and water temperatures: this table contains no sea data and cannot tell you whether swimming will feel comfortable.
Check again close to departure, especially if you are planning an excursion with little shade or relying on transport; the guide helps you choose a season, but does not replace up-to-date practical information.
Your city, in your inbox.
Useful news and plans for Torrevieja and the surrounding area. Mondays at 08:00 and Thursdays at 18:00 (Europe/Madrid): two emails a week. In English, free and without the noise.
Your choice. Confirm your email and unsubscribe at any time.